
Knowledge Base
Trading Library
Battle-tested documentation on execution models, risk management mathematics, session dynamics, and behavioral psychology.
Search Knowledge BaseFilter by execution model, risk math, or strategy
Battle-tested documentation on execution models, risk management mathematics, session dynamics, and behavioral psychology.
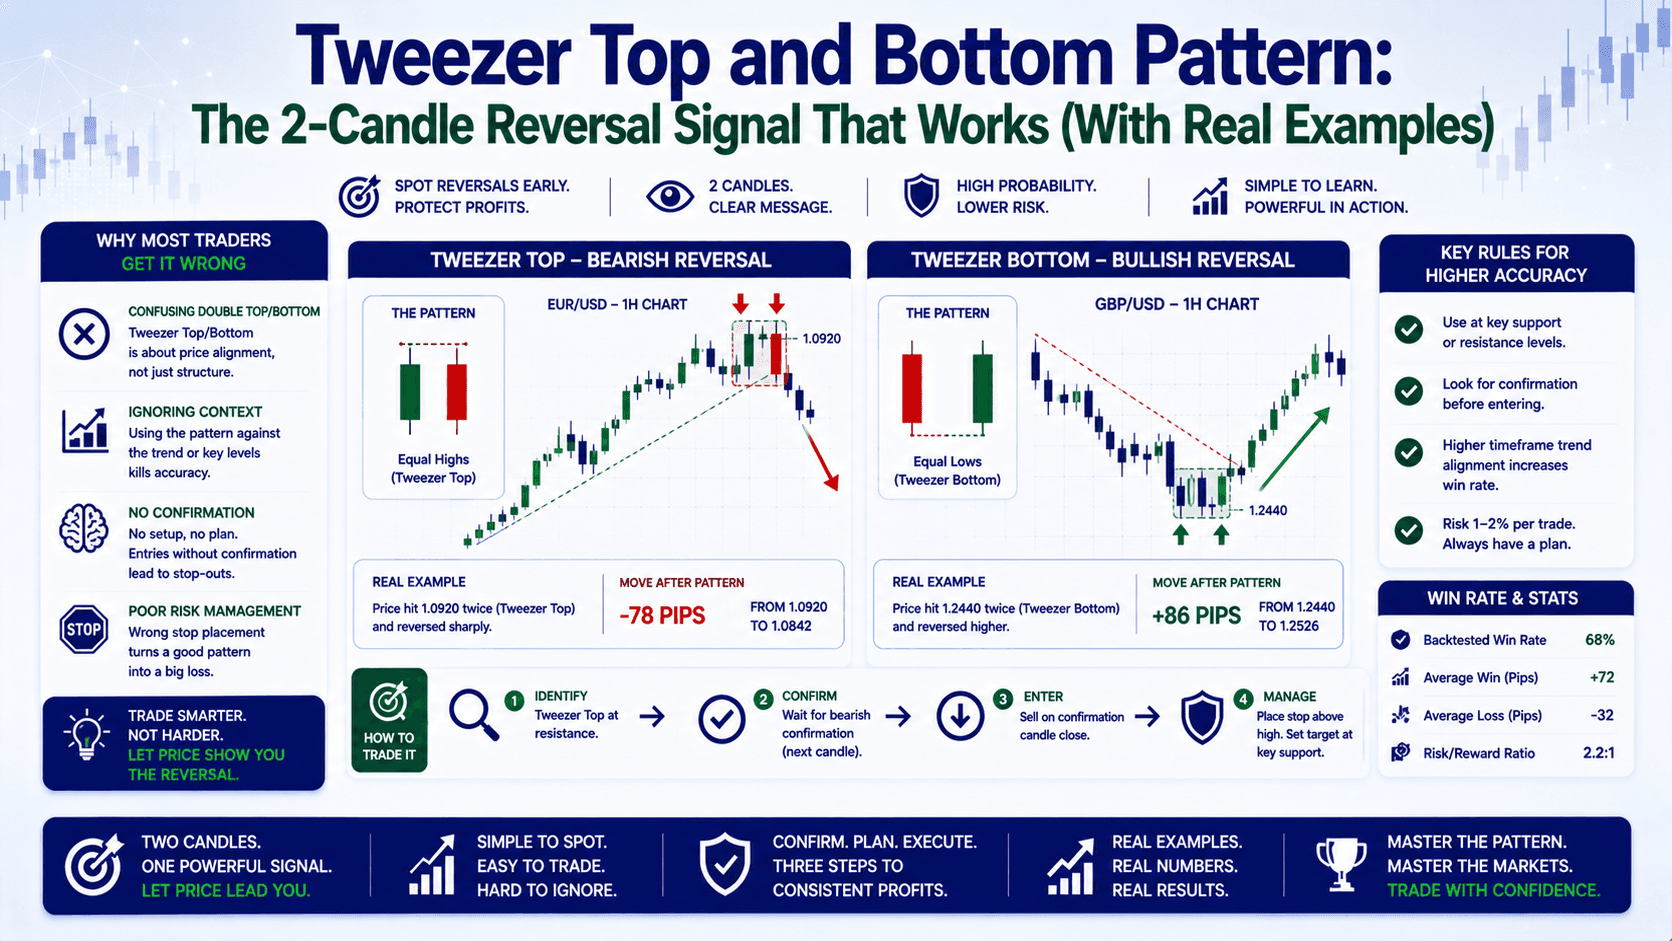
You've Seen This Before — And It Cost You Money EUR/USD is in a solid uptrend. Price hits 1.0920, pulls back, then hits 1.0920 again. You think "double top,...

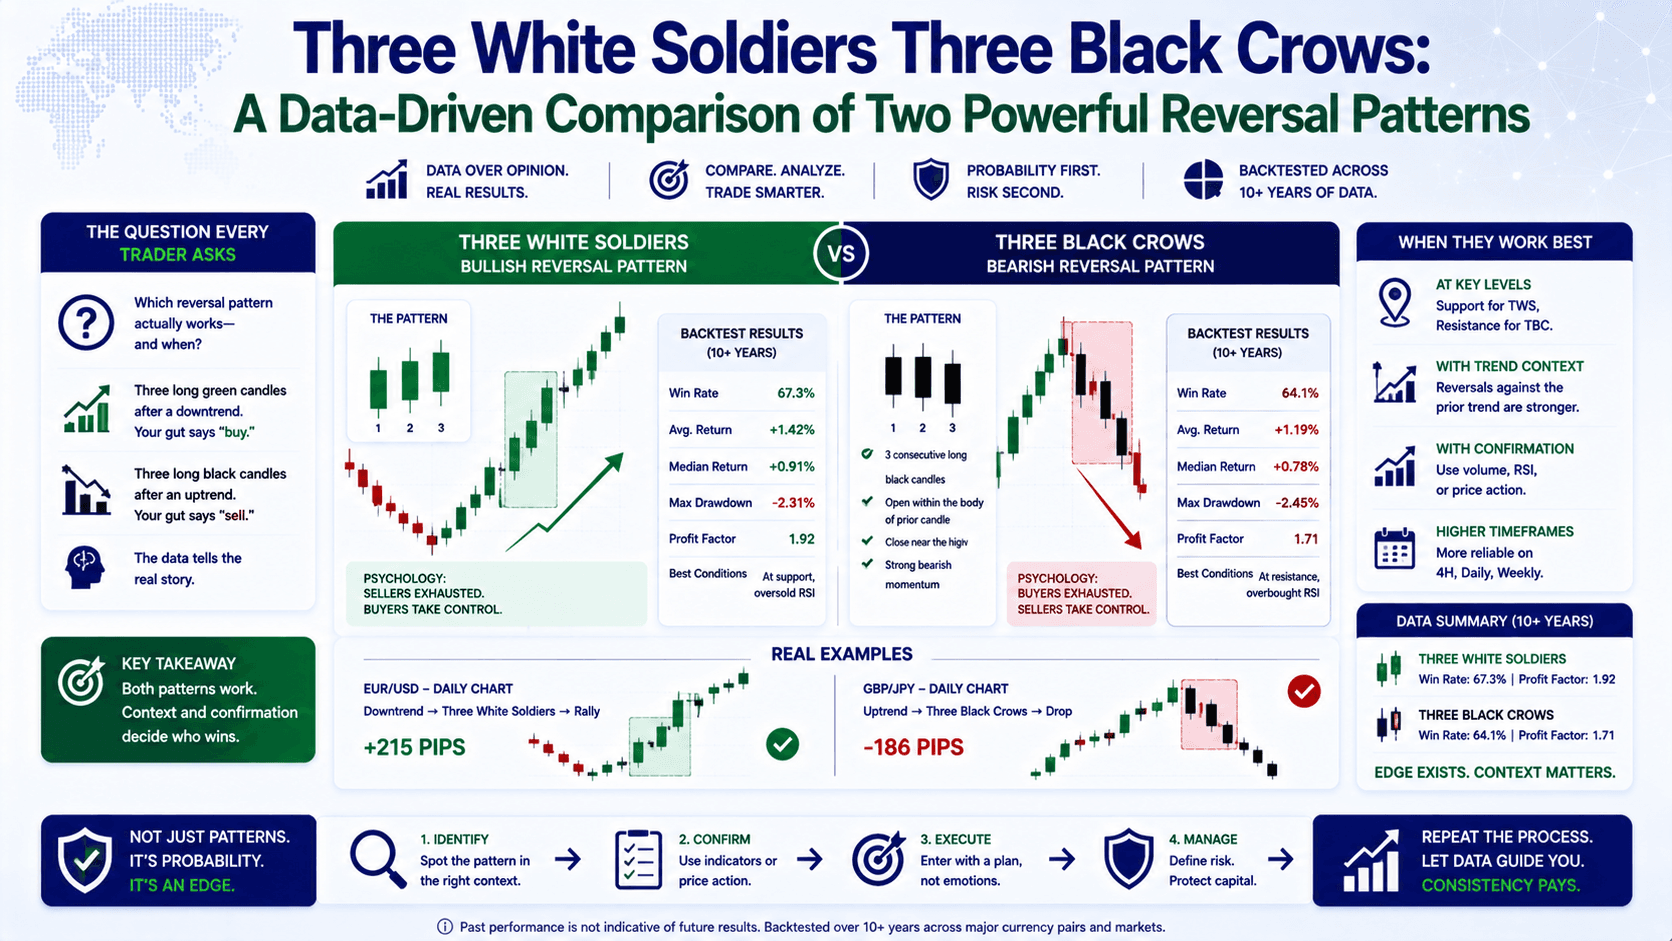
Which reversal pattern actually works—and when? You see three long green candles marching upward after a downtrend. Your gut says "buy." Three days later,...
What Does a Doji Candlestick Actually Tell You? Let's start with a scenario you've probably lived through. You're watching EUR/USD at 1.0920. It's been...
Why Triple Tops and Triple Bottoms Are Different From Every Other Reversal Pattern You've seen the double top. Price hits resistance, pulls back, hits it...
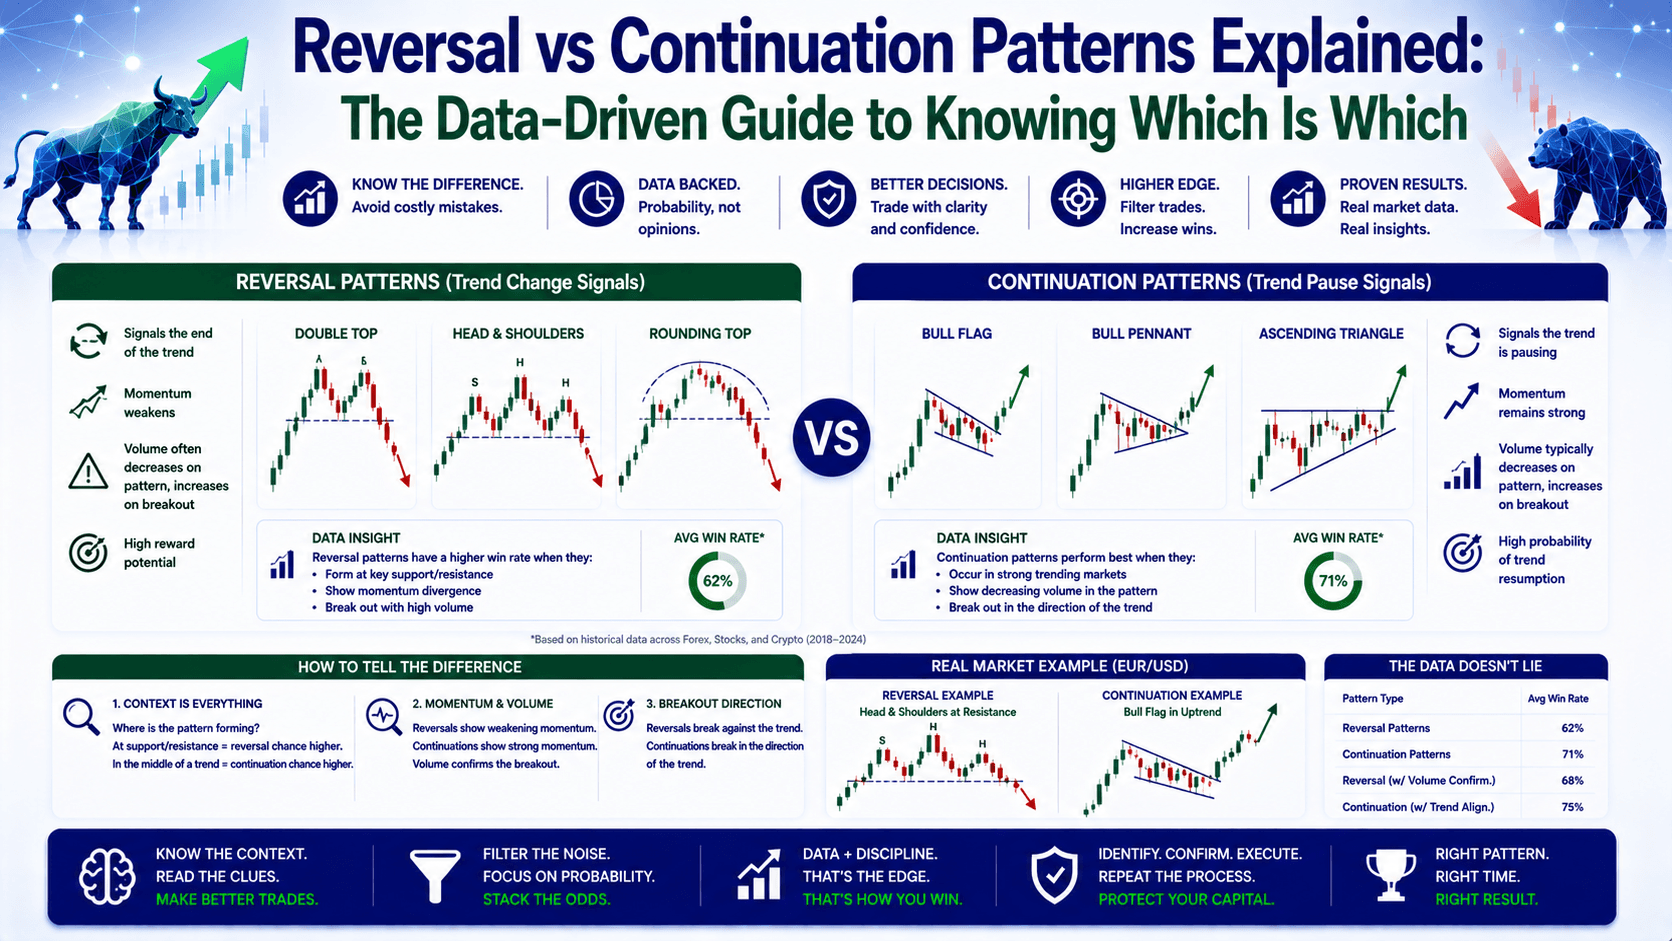
You See a Pattern. But Is It a Pause or a Turn? You're staring at your chart. EUR/USD has been trending up for three days. Suddenly, the candles start...
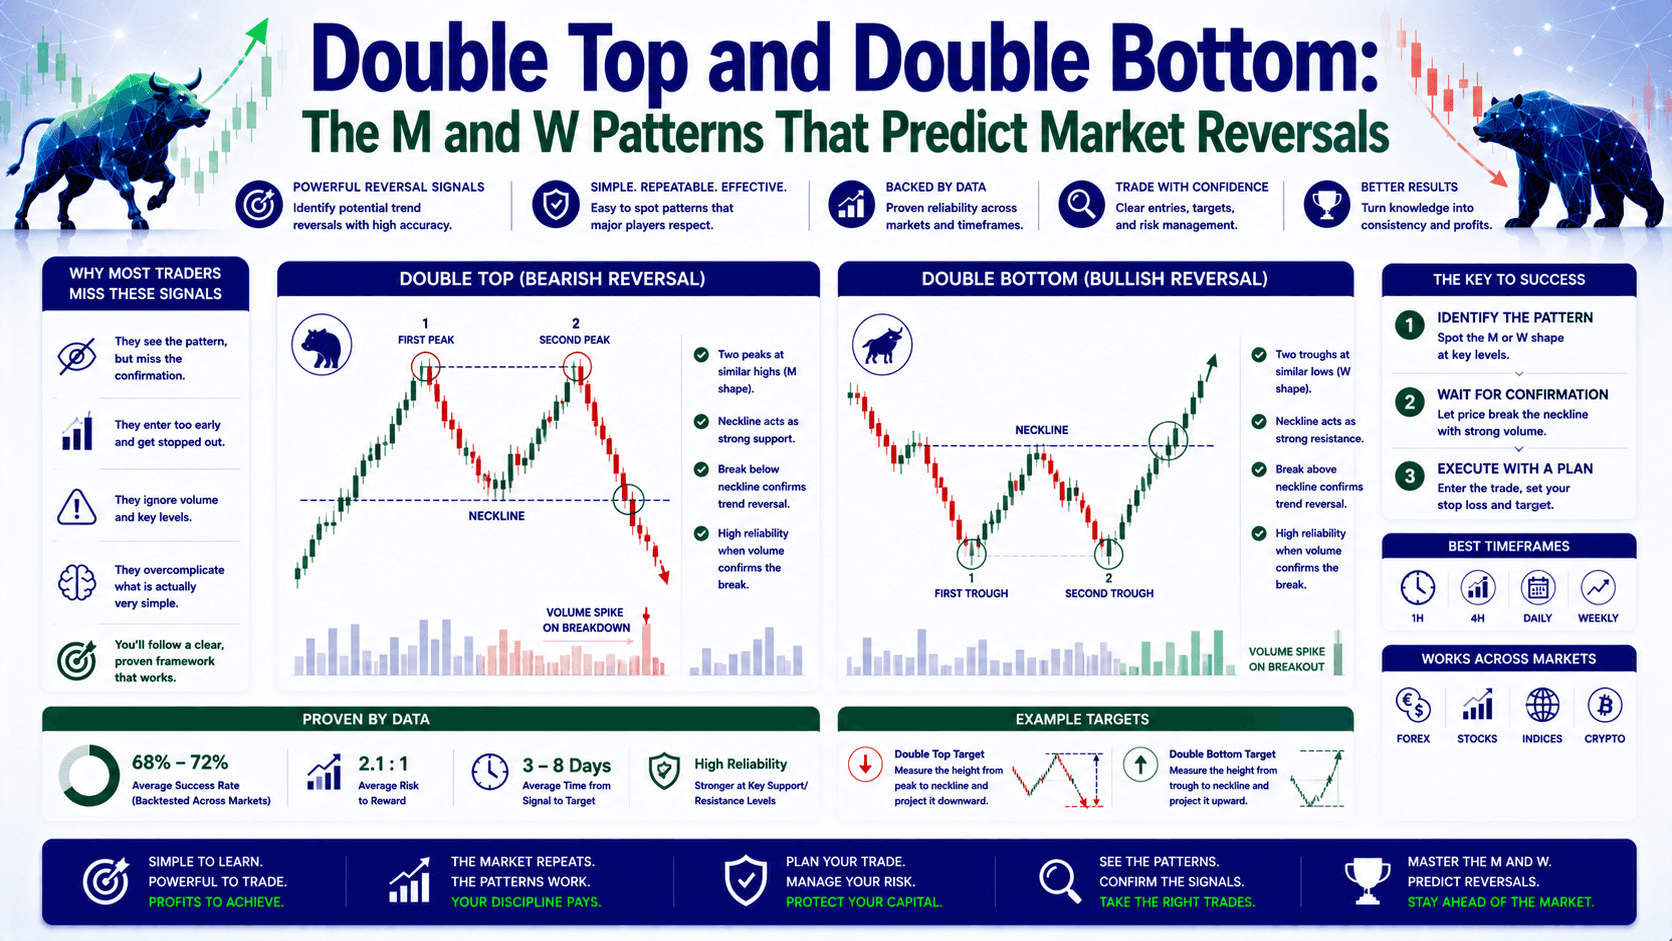
Why Most Traders Miss These Reversal Signals — And How You Won't You're watching EUR/USD climb. It hits 1.0950, pulls back to 1.0920, then rallies again to...
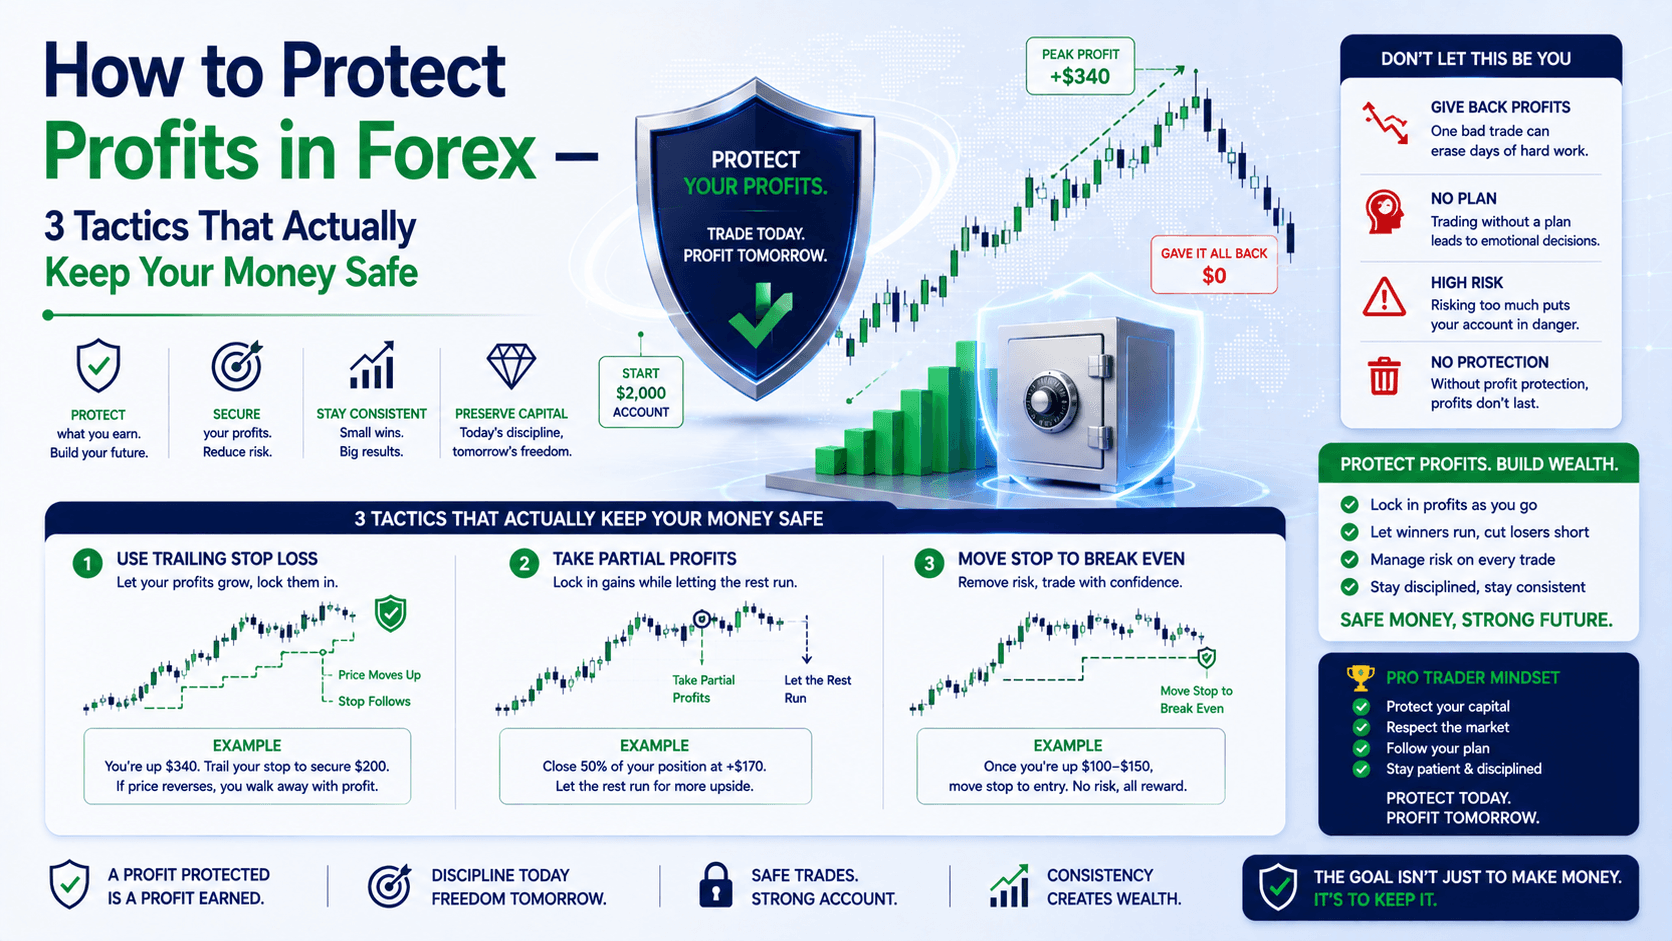
Which Chart Patterns Actually Work in Forex? Let me guess. You've looked at chart patterns before and thought: "That looks like a head and shoulders... or...
Risk Warning & Disclaimer:Trading forex, cryptocurrencies, and CFDs carries a high level of risk and may not be suitable for all investors. You may lose more than your initial investment. Only trade with money you can afford to lose. Past performance is not indicative of future results. TheNextTrade provides software tools and trade analytics only and does not act as a broker, custodian, or financial advisor.
Restricted Jurisdictions:The information, software tools, and partner broker links on this website are directed at global markets and are not intended for distribution to, or use by, any person in any country or jurisdiction where such distribution or leveraged FX/CFD trading would be contrary to local law or regulation (including the United States, Vietnam, and other restricted territories).